Portfolio
Browse through a selection of digital mapping projects that highlight our expertise in delivering visually captivating and data-driven mapping solutions. From interactive web maps to spatial data analysis, each project showcases our commitment to excellence in crafting innovative and engaging spatial experiences.

Real Estate Data Visualization
The client had a large data set from Massachusetts MLS with various metrics for each municipality for several years.
We represented this data with a choropleth map built with Leaflet, an open source JavaScript mapping library, and added a drop-down to select different metrics and a slider to select and play through the time series data.
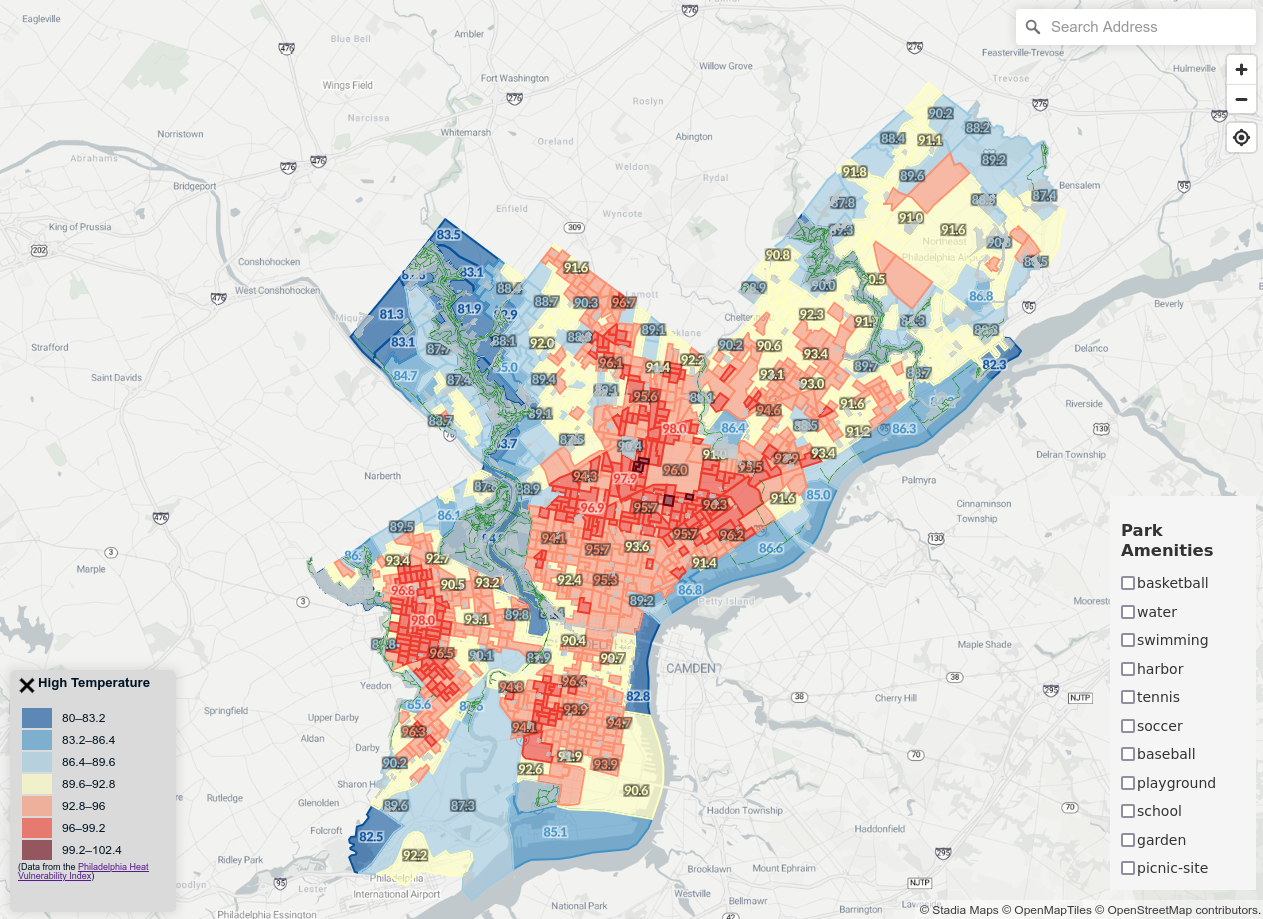
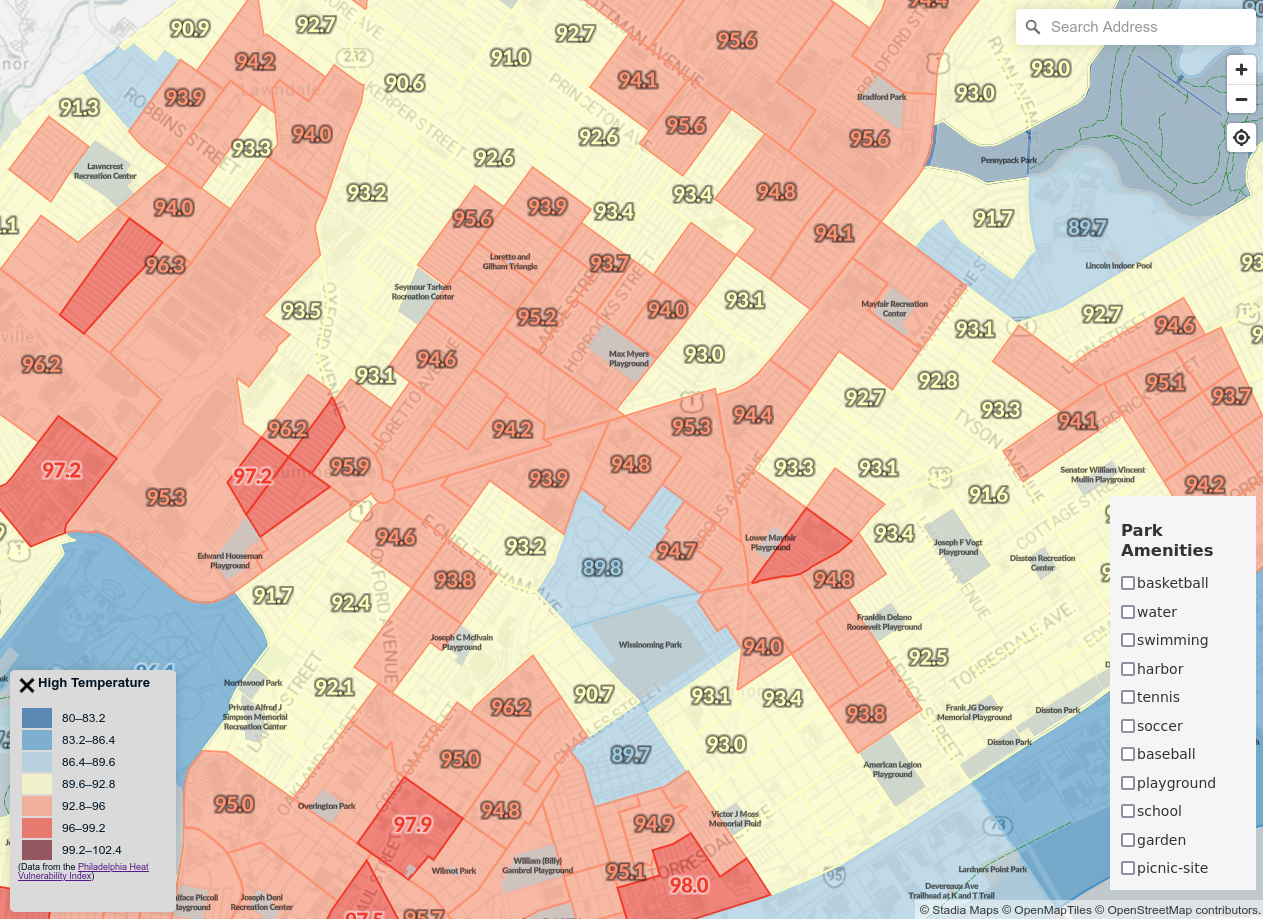
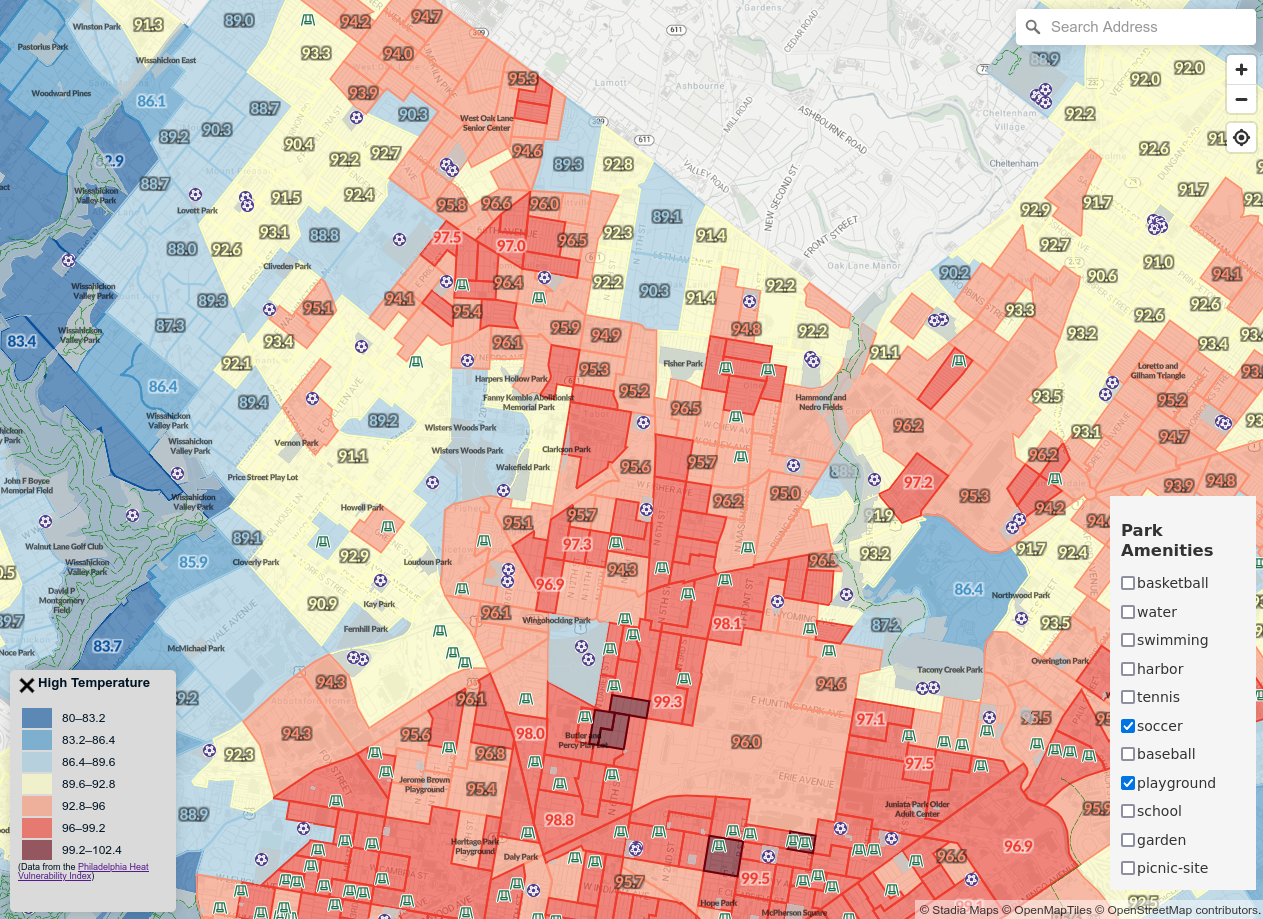
Heat Vulnerability Across Philidelphia
This project aimed to visualize the heat vulnerability by census tract in Philadelphia.
We used Maplibre GL JS to create a choropleth map with census tracts colored by temperature and a symbol layer displaying the temperature as a number. We used an additional symbol layer to overlay parks and park amenities.

Roadside Assistance Map
This client wanted to visualize cases for their roadside assistance company.
A heatmap is generated from the data each day starting at midnight. In addition, icons pop up for new cases, starting blue with an animated halo, then turning yellow and static.
We developed an API which our client integrated with their own data workflow.
Discover Our Diverse Portfolio
We are proud to showcase a glimpse of our work here at ArtemisMAPs. While working with our client to understand their unique needs, we craft innovative and impactful creations that exceed expectations. Through a collaborative approach, we ensure stunning visualizations and interactive maps that cater to diverse requirements. At ArtemisMAPs, we are committed to providing exceptional services that leave a lasting impression. Explore these remarkable demonstrations of our work and experience the unparalleled level of craftsmanship and professionalism we bring to every project.
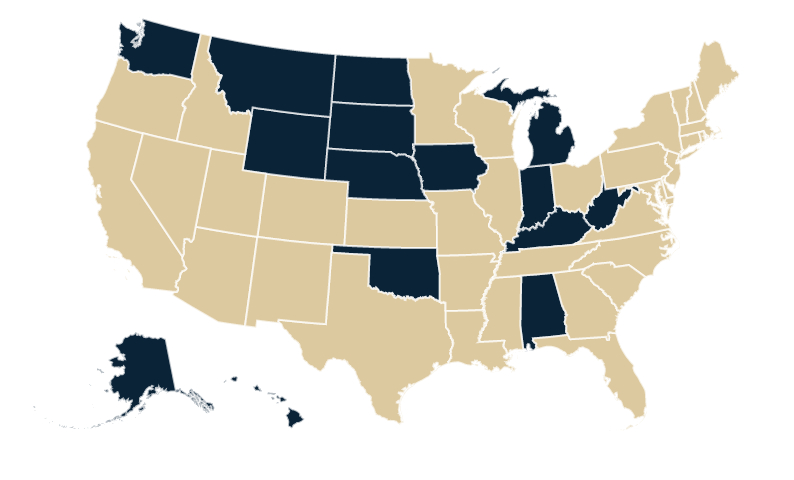

Interactive US State Map Highlighting Client Reach
In this project, we used D3.js to create an interactive US state map, highlighting our client’s service areas. The map features animations for engagement and offers users insights into the client’s coverage. It works well with the client’s overall website design.
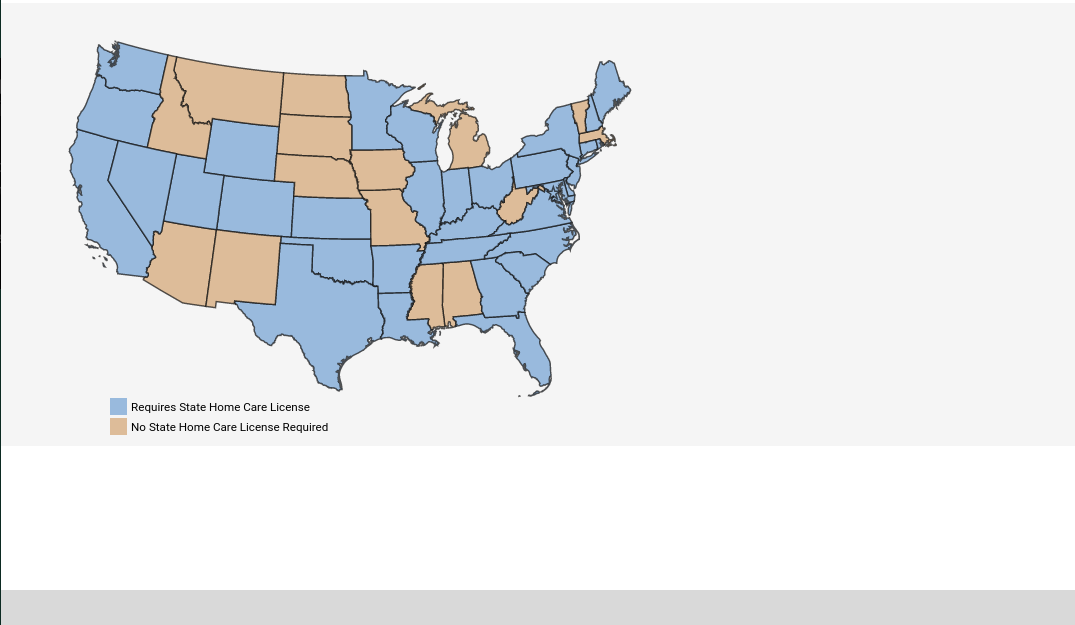
Infographic of State-Specific Requirements
In this project, we designed an informative infographic using D3.js that displays state-specific requirements. Users can click on a state to access detailed information about its specific regulations and guidelines. This interactive tool simplifies complex data, making it easy for users to access the information they need quickly and efficiently.


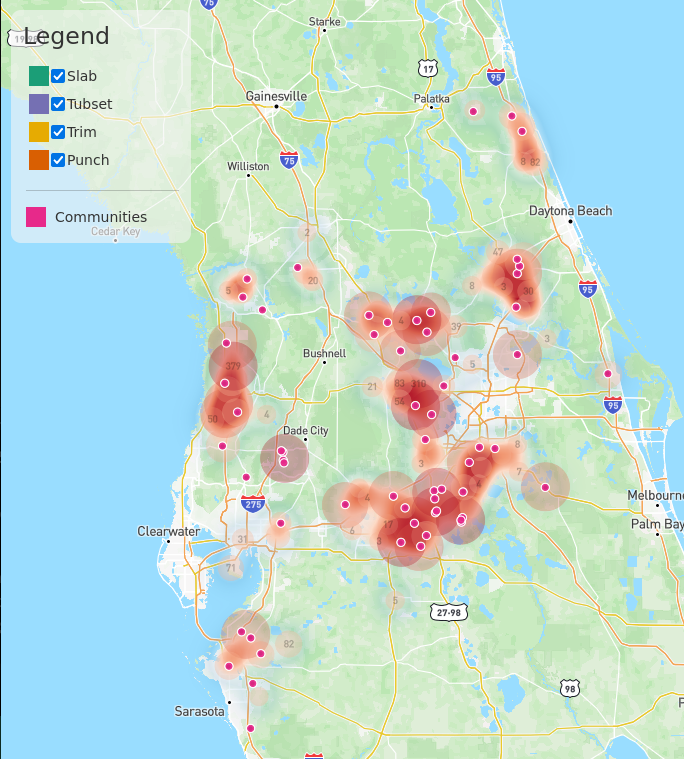
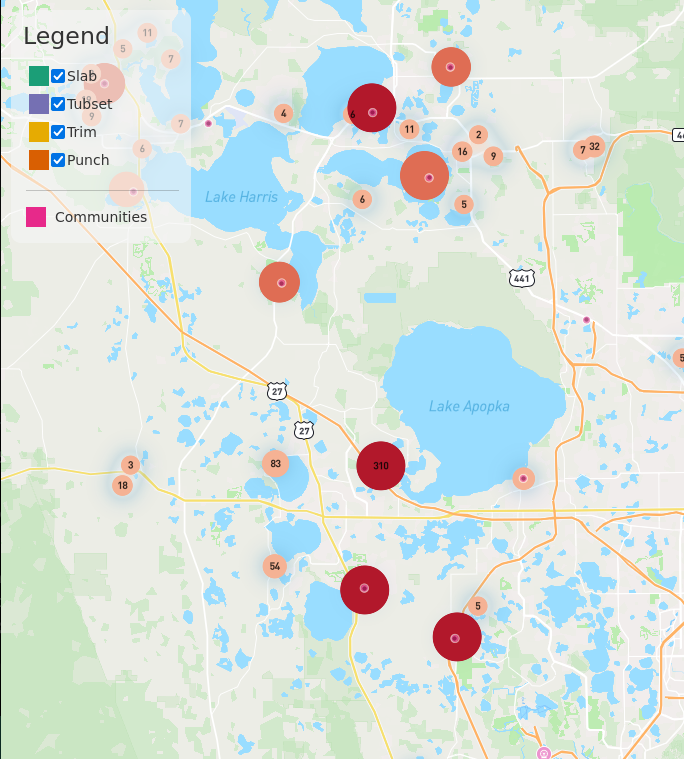
Business Intelligence and Analysis
For this project, we created a dynamic map solution that leverages the power of Mapbox to analyze job distribution. At lower zoom levels, users can explore a heatmap illustrating the overall job distribution, providing valuable insights at a glance. Upon zooming in, the map seamlessly transitions to display individual job locations as clustered point features, allowing for a closer examination of specific areas. Additionally, users have the flexibility to filter and explore different job categories, enhancing the map’s versatility for precise analysis.
Get Started with ArtemisMAPs
Unlock the power of spatial data with our digital mapping development and GIS consulting services. Contact us today to discuss your project and let us help you create compelling and insightful mapping solutions that make an impact.
187 Pavilion Pkwy, #123, Newport, KY 41071
